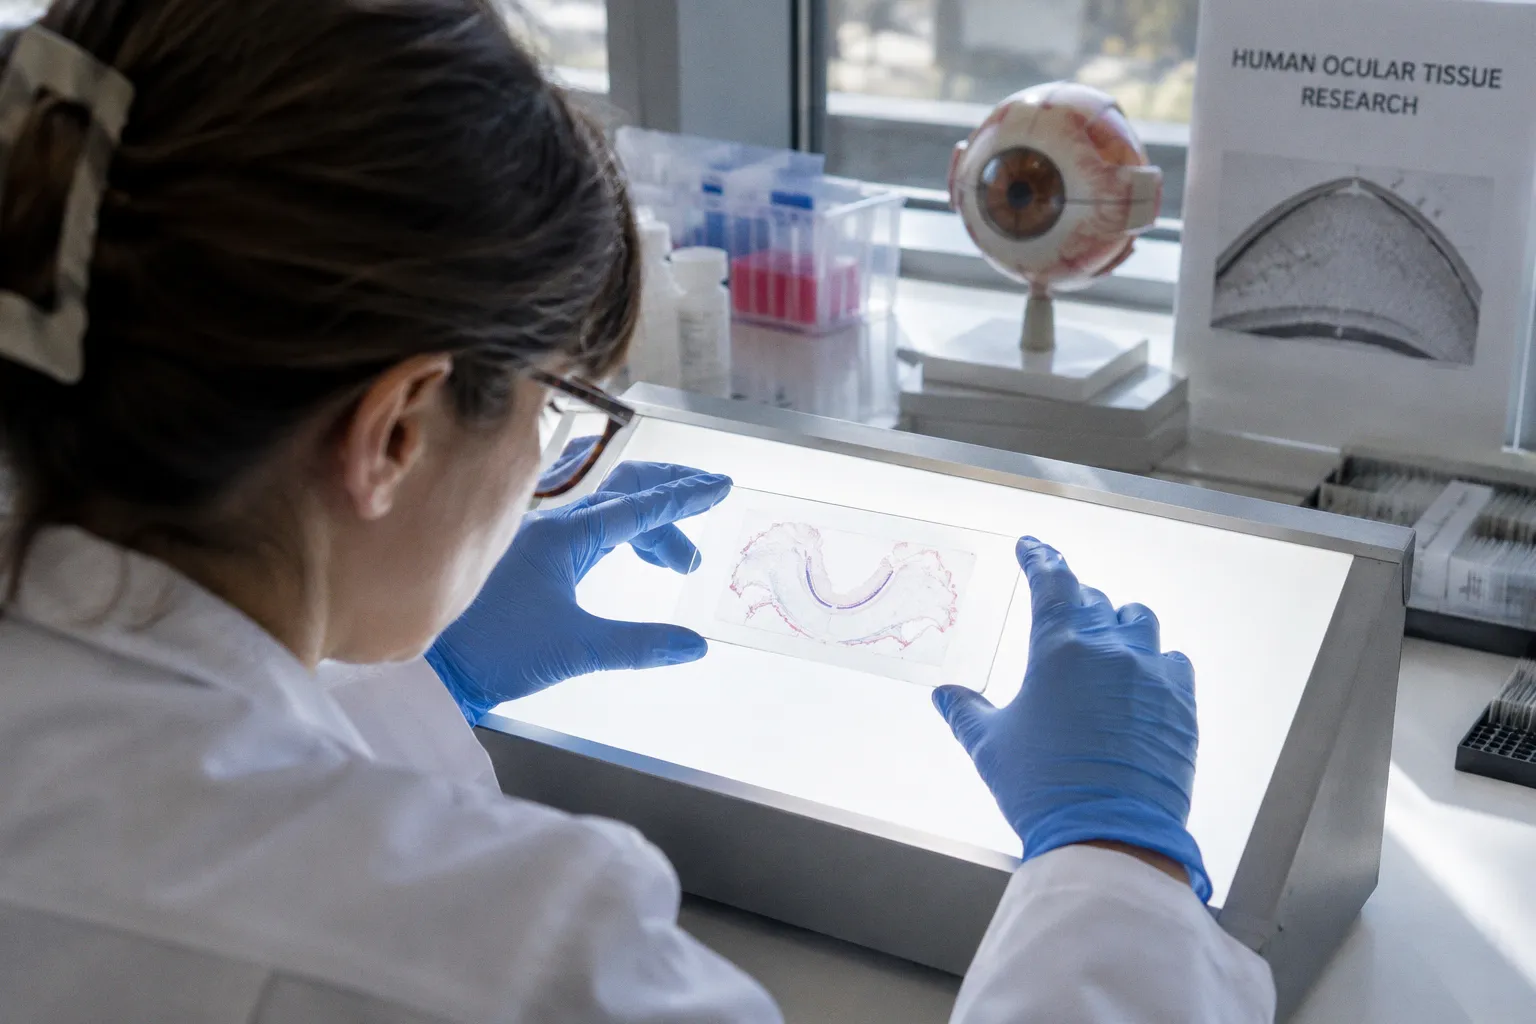
Single-cell and single-nuclei workflows preserve cellular identity and expose the composition of that fragment. In ocular research, this distinction is operational rather than cosmetic. The retina, retinal pigment epithelium, cornea, conjunctiva, lacrimal gland, and vascular compartments contain multiple cell populations with different transcriptional programs, injury responses, and degradation kinetics.
The central decision in bulk RNA-seq vs single-cell RNA-seq for ocular tissue is therefore not simply whether more reads are available. It is whether the study requires deeper measurement of a mixed tissue signal or attribution of that signal to defined cell populations.
For a whole-tissue pathway screen across a large donor cohort, bulk RNA-seq remains efficient and analytically stable. For questions involving rare populations, regional variation, cellular composition, or disease mechanisms localized to a specific ocular cell type, single-cell or single-nuclei sequencing provides a different level of transcriptomic resolution.
The resolution gap: why bulk sequencing masks ocular heterogeneity
Bulk RNA-seq collapses the tissue into one expression vector. Every read contributes to a combined profile generated by the cells present in the sampled fragment. This is useful when the research question concerns total transcript abundance or broad pathway activity. It becomes limiting when the tissue contains several populations with opposing or highly unequal expression patterns.
The retina is a direct example. Single-cell transcriptomic profiling can distinguish 11 major retinal cell classes, including rods and cones, bipolar cells, amacrine cells, horizontal cells, retinal ganglion cells, glial cells, and vascular bed cells. A bulk retinal sample combines these populations before sequencing. The resulting expression value for a gene may reflect:
- A genuine change in transcription within one cell type.
- A change in the proportion of cell types within the sample.
- Loss of a vulnerable population during disease progression.
- Regional differences between macular and peripheral tissue.
- Variable contribution from vascular or glial compartments.
- Technical differences in tissue dissection and sample composition.
This is the primary confounding structure of bulk transcriptomics in donor eye studies. A gene can appear differentially expressed because its source population has expanded, contracted, or been selectively lost. The measurement does not, by itself, distinguish compositional change from cell-intrinsic regulation.
That limitation matters in glaucoma, optic neuropathy, retinal degeneration, and vascular disease. A lower signal for a retinal ganglion cell marker may indicate reduced expression in surviving ganglion cells. It may also indicate fewer ganglion cells in the sampled region. Bulk data alone cannot resolve those possibilities.
Bulk RNA-seq measures the tissue average. Ocular pathology is often driven by the minority population that the average conceals.
The problem is amplified by anatomical sampling. A donor eye is not a uniform biological unit. The macula, peripheral retina, optic nerve head, retinal pigment epithelium, choroid, and vascular bed have different cellular compositions and different susceptibility to disease. A small change in dissection boundary can alter the bulk profile without any molecular change inside the cells themselves.
For this reason, bulk RNA-seq is strongest when the sample definition is consistent, the tissue is relatively homogeneous, and the study requires cohort-scale comparison. It is weaker when anatomical region and cellular composition are central variables.
What single-cell granularity adds to a human retinal cell atlas
Single-cell RNA-seq changes the unit of analysis from the tissue fragment to the individual cell. Single-nuclei RNA-seq applies the same principle to isolated nuclei and is particularly relevant for frozen post-mortem tissue, where intact-cell recovery may be limited.
The result is not simply a larger expression matrix. It is a map of cellular identity, state, and distribution. In an ocular tissue study, this allows the analyst to separate:
1. Cell classes. Rods, cones, bipolar cells, amacrine cells, horizontal cells, retinal ganglion cells, glia, and vascular populations can be identified through characteristic transcriptional programs.
2. Cell states. Cells within the same class may show stress, inflammatory, aging-related, or disease-associated signatures.
3. Rare populations. Low-abundance subsets can be detected rather than diluted into the dominant tissue signal.
4. Regional programs. Macular and peripheral retinal profiles can be compared at the level of specific cell types.
5. Composition and regulation. Changes in the number of cells and changes in gene expression within those cells can be modeled separately.
A reference human retinal transcriptomic atlas profiled 20,009 single cells. The value of such an atlas is not limited to the number of cells. It establishes a reference vocabulary for annotating donor samples and determining whether a disease-associated signal belongs to photoreceptors, retinal ganglion cells, Müller glia, vascular cells, or another compartment.
This is the core methodological advantage of single-cell sequencing in ophthalmology research. The study can move from the question of which genes changed in the retina to the more useful question of which cell population changed, in what direction, and in which anatomical region.
However, single-cell data introduces its own analytical dependencies. Cell identity is inferred through marker genes and clustering structure. Low-abundance transcripts may be missed. The captured population is shaped by tissue dissociation, nuclei isolation, preservation, sequencing depth, and filtering rules. A high-resolution matrix is not automatically a complete representation of the tissue.
Cell number is not the same as transcriptomic completeness
The distinction between cellular resolution and molecular depth is often lost in platform comparisons. A single-cell experiment may profile thousands of cells while measuring a limited subset of transcripts per cell. Bulk RNA-seq typically provides greater depth for the average transcriptome and can be advantageous for detecting lower-abundance transcripts across a relatively uniform sample.
This creates a direct trade-off:
- Bulk sequencing increases depth per aggregate sample.
- Single-cell sequencing increases attribution of expression to individual cell populations.
- Single-nuclei sequencing improves access to frozen post-mortem material but does not reproduce every cytoplasmic transcript signal.
- Long-read approaches address transcript isoform structure but should not be conflated with standard short-read single-cell sequencing.
Retinal mRNA splice isoform profiling has used 1.54 billion Illumina short reads and 1.4 billion nanopore long reads. Those figures illustrate a separate axis of measurement: transcript structure and isoform resolution. They do not establish that conventional scRNA-seq captures full-length isoforms. Full-length interpretation requires an explicitly specified long-read single-cell method, such as a Nanopore- or PacBio-based workflow.
Post-mortem donor eyes: why single-nuclei RNA-seq changes the workflow
Post-mortem ocular tissue introduces a timing and preservation problem before sequencing begins. The material may be anatomically valuable but operationally constrained. Procurement latency, tissue temperature history, dissection order, freezing status, and regional sampling all affect downstream molecular recovery.
For intact-cell scRNA-seq, tissue dissociation is an additional bottleneck. Ocular tissues contain structurally distinct compartments and cell types with unequal resistance to enzymatic and mechanical processing. The resulting suspension may overrepresent cells that survive dissociation and underrepresent cells that are fragile, tightly embedded, or difficult to release.
Single-nuclei RNA-seq reduces part of this constraint. Frozen human retinal tissue can be used to profile nuclear transcriptomes from post-mortem donor samples. This makes the method suitable for biobanked material that cannot reliably produce a viable whole-cell suspension. It also supports retrospective analysis of tissue collections where the original procurement workflow was not designed around immediate dissociation.
The advantage is not unrestricted. Nuclear RNA profiles are not interchangeable with whole-cell profiles. Nuclear preparations emphasize transcripts present in or near the nucleus and may differ in intronic content, RNA abundance, and representation of cytoplasmic transcripts. The correct comparison is therefore not “fresh tissue versus frozen tissue” in the abstract. It is a comparison of biological question, preservation state, isolation method, and expected signal.
In practical terms, a donor-eye data pipeline needs to track more than sample ID and diagnosis. The metadata should preserve the variables that can alter interpretation:
- Tissue region and dissection boundaries.
- Retina, RPE, choroid, optic nerve, cornea, or ocular surface designation.
- Post-mortem interval and procurement latency, where available.
- Fresh, frozen, or nuclei-based preparation.
- Donor age and disease classification.
- Sequencing modality and read architecture.
- Cell or nuclei recovery metrics.
- Exclusion rules and annotation confidence.
- Batch, library, and processing date.
Without this metadata, a high-dimensional dataset can still produce low-confidence conclusions. The computational pipeline may detect clusters, but it cannot reconstruct missing provenance.
Macula versus peripheral retina
Regional comparison is one of the clearest use cases for snRNA-seq in human donor eyes. Single-nuclei profiling has revealed cell-type-specific and region-specific differences between the macula and peripheral retina that bulk RNA-seq can miss.
The distinction is essential for studies of macular degeneration, retinal aging, vascular changes, and regionally selective disease susceptibility. A bulk comparison between macular and peripheral tissue may identify a difference, but the signal can remain ambiguous. It may result from different cell proportions, different transcriptional states within the same cell class, or both.
A nuclei-resolved design can assign the regional effect to specific compartments. That does not remove the need for careful sampling. The macula is small, anatomically specialized, and vulnerable to boundary errors. The peripheral comparator also requires a defined location rather than a generic label. Tissue geography becomes part of the molecular model.
Beyond the retina: RPE, cornea, and ocular surface compartments
The same resolution problem appears outside neural retina. Ocular surface tissues combine multiple epithelial, glandular, immune, stromal, and vascular components. Bulk RNA-seq can describe the composite tissue response. It cannot reliably assign a disease-associated signature to the corneal epithelium, endothelium, conjunctiva, meibomian gland, or lacrimal gland without additional deconvolution assumptions.
Single-cell analysis of ocular surface tissues enables resolution of cell states across the cornea, meibomian glands, conjunctiva, and lacrimal glands. This is relevant to biomarker discovery in Fuchs corneal endothelial dystrophy, keratoconus, and dry eye disease. Each condition can involve several interacting compartments, but the clinically useful signal may originate in a limited subset of cells.
The RPE presents a similar case. A single-cell study of 9,302 human RPE cells from three donor samples identified distinct subpopulations, including a cluster expressing ID3 as a macular RPE marker. The finding is important because RPE is often treated as a uniform layer in sample descriptions despite clear regional specialization.
For donor-eye procurement, this has a direct consequence: “RPE sample” is not sufficient metadata. A usable multiomics record should distinguish at least the anatomical region, isolation strategy, preservation mode, and whether the preparation contains adjacent choroidal or retinal material. Contamination is not a minor technical footnote when the research question concerns cell-specific expression.
Bulk versus single-cell: operational comparison
| Parameter | Bulk RNA-seq | Single-cell / single-nuclei RNA-seq |
|---|---|---|
| Primary measurement | Average expression across the sampled tissue | Expression profiles assigned to individual cells or nuclei |
| Cellular heterogeneity | Hidden inside the aggregate signal | Directly resolved through clustering and annotation |
| Rare populations | Easily diluted by dominant populations | Detectable when captured and sequenced adequately |
| Tissue composition effects | Major confounder | Measured as part of the cellular distribution |
| Frozen post-mortem tissue | Compatible with many workflows | snRNA-seq is particularly suited to frozen donor material |
| Transcript depth | Generally stronger per aggregate sample | Distributed across many cells or nuclei |
| Regional retinal analysis | Can detect regional differences but not their cellular source | Can assign regional differences to specific cell populations |
| Cohort-scale screening | Efficient for large, consistent sample sets | More complex in library preparation and analysis |
| Isoform analysis | Stronger with deep or long-read bulk designs | Requires explicitly specified long-read single-cell methods for full-length interpretation |
| Main failure mode | Misinterpreting composition changes as regulation | Overinterpreting incomplete capture, batch effects, or annotation artifacts |
The table is not a ranking. It describes two different data products. The appropriate platform follows from the causal structure of the biological question.
Spatial transcriptomics versus single-cell eye analysis
Spatial transcriptomics is often introduced as the next step after single-cell sequencing. In ocular tissue, the distinction is practical. Single-cell and single-nuclei methods provide cellular transcriptomic identity but usually disrupt the original tissue geometry during dissociation or nuclei isolation. Spatial methods preserve location to varying degrees and can associate molecular signals with anatomical coordinates.
For retinal research, location can determine interpretation. A gene expressed in a retinal ganglion cell near the optic nerve head may have a different pathological relevance from the same signal in a peripheral region. Likewise, RPE and choroid interactions cannot be fully reconstructed from a dissociated expression matrix.
Spatial transcriptomics can therefore answer questions that single-cell RNA-seq answers only indirectly:
- Where in the retinal layer is the signal located?
- Is a disease-associated program adjacent to vessels, photoreceptors, or the optic nerve head?
- Does a regional expression pattern follow a recognizable anatomical boundary?
- Are interacting cell populations positioned close enough to support a local mechanism?
The limitation is that spatial platforms differ in resolution and transcript capture characteristics. A spatial spot may contain several cells, while a high-resolution method may generate a more fragmented signal. Spatial data also requires accurate tissue preservation, sectioning, imaging, and registration. It should not be treated as a universal replacement for scRNA-seq.
A strong design may combine methods. Bulk RNA-seq can screen broad cohort-level patterns. Single-cell or single-nuclei sequencing can identify the cellular source. Spatial transcriptomics can test whether the signal occupies the expected anatomical compartment. These layers answer related but non-identical questions.
Cellular identity, transcript depth, and anatomical position are separate dimensions. No single sequencing modality maximizes all three.
How to select the method for an ocular pathology study
The selection should begin with the endpoint, not the platform name. A procurement team or research group deciding between bulk and single-cell sequencing should define the minimum resolution required to support the intended claim.
Use bulk RNA-seq when the study requires aggregate depth
Bulk RNA-seq remains the rational choice when:
- The tissue is comparatively homogeneous or tightly standardized.
- The primary endpoint is whole-tissue differential expression.
- The study requires screening across a large donor cohort.
- The analysis focuses on pathway-level changes rather than rare cellular states.
- The tissue quantity is limited but sufficient for a concentrated aggregate library.
- The study needs robust average transcript abundance or deeper bulk transcript profiling.
- A follow-up method will localize the signal after initial discovery.
Bulk data is also useful as a baseline for multiomics integration. A proteomic or methylation signal may be compared with a bulk transcriptome when the research question concerns the total tissue response. The interpretation must still account for changes in cellular composition.
Use scRNA-seq when cell identity is causal
Single-cell RNA-seq is justified when the study depends on:
- Rare or disease-associated cell populations.
- Cell-type-specific biomarkers.
- Heterogeneous ocular surface compartments.
- Distinguishing regulatory change from population loss.
- Mapping multiple retinal cell classes in the same sample.
- Comparing cell states across disease, age, or treatment groups.
- Constructing or extending a human retinal cell atlas.
The method is most informative when the experimental design includes enough biological replication to separate donor effects from cell-level variation. Thousands of cells from one donor do not substitute for multiple donors. Cell count increases the resolution of the sample; it does not independently establish population-level generalizability.
Use snRNA-seq when preservation and procurement define the constraint
Single-nuclei sequencing becomes particularly attractive when:
- The donor material is frozen.
- Intact-cell dissociation is unreliable or unavailable.
- The tissue is archived in a biobank.
- Retrospective analysis is required.
- The study needs cell-type resolution from post-mortem human retina.
- The procurement workflow cannot support rapid processing into a viable suspension.
This is where logistics directly shape assay selection. A theoretically superior assay that cannot be applied consistently across donor material produces a weaker dataset than a less expansive assay with stable provenance and repeatable recovery.
Data interpretation: where the comparison is usually mishandled
The most common error is to treat single-cell output as automatically more accurate. It is more resolved, not universally more accurate. The data has additional failure modes:
1. Sampling imbalance. Some cell types are captured more efficiently than others.
2. Dissociation or isolation bias. Processing can alter representation and stress-related expression.
3. Ambient RNA. Transcripts released by abundant populations may contaminate profiles from other cells.
4. Doublets and multiplets. Two cells or nuclei can be assigned as one profile.
5. Batch structure. Donor, library, processing date, and operator effects can create apparent clusters.
6. Annotation drift. Marker-based labels may vary across tissues, regions, and reference atlases.
7. Overinterpretation of low-count genes. A detected transcript in a small cluster is not automatically a validated biomarker.
Bulk RNA-seq has a different error profile. Its primary risks are composition confounding, regional mixing, and overinterpretation of average expression changes. These risks are quieter because the matrix is simpler. A clean differential-expression result can still represent a change in tissue mixture rather than a regulatory event.
A robust analysis keeps the measurement model visible. In bulk data, ask which populations generated the signal. In single-cell data, ask which populations were captured, which were lost, and how confidently they were annotated.
A decision framework for donor-eye multiomics
For an ocular biobanking and research coordination pipeline, the method decision can be expressed as a sequence of constraints:
1. Define the anatomical unit. Retina is not equivalent to macula, peripheral retina, RPE, choroid, or optic nerve head.
2. Define the biological unit. Decide whether the endpoint concerns the tissue average, a cell class, a rare subpopulation, or a spatial interaction.
3. Inspect preservation status. Fresh, frozen, and nuclei-compatible material support different workflows.
4. Estimate heterogeneity before sequencing. Known mixtures of neuronal, glial, vascular, epithelial, and immune populations favor cell-resolved approaches.
5. Set the required molecular depth. Deep aggregate transcript abundance may favor bulk sequencing.
6. Set the required attribution. Cell-specific biomarker discovery requires scRNA-seq or snRNA-seq.
7. Specify regional metadata. Macular and peripheral samples should not be pooled under a single retinal label.
8. Plan validation. A cell-resolved discovery signal may require spatial, histological, proteomic, or targeted molecular confirmation.
9. Preserve provenance. Procurement latency, freezing history, dissection details, and processing batch should remain linked to the sequence data.
10. Match claims to the assay. Do not make isoform-level, spatial, or cell-state claims that the selected modality cannot support.
This framework avoids the false binary of “old bulk method versus advanced single-cell method.” In a mature ophthalmic multiomics program, the methods are often sequential. Bulk RNA-seq provides breadth. Single-cell or single-nuclei sequencing provides attribution. Spatial analysis provides anatomical context. Proteomics tests whether transcriptional changes propagate to the protein layer.
Final assessment
Bulk RNA-seq remains the higher-throughput instrument for measuring average transcript abundance across standardized ocular tissue samples. It is appropriate for cohort screening, broad pathway analysis, and deep aggregate expression profiling. Its limitation is structural: mixed-cell signals cannot reliably identify the cell population responsible for a change.
Single-cell RNA-seq provides cellular granularity in fresh or suitably processed material. Single-nuclei RNA-seq extends that granularity to frozen post-mortem donor eyes and is therefore especially relevant to ocular biobanks. Both approaches can resolve retinal heterogeneity that bulk sequencing compresses, including major retinal cell classes, regional macular differences, and subpopulations within the RPE and ocular surface.
The correct choice is determined by the claim the study must support. If the claim concerns the tissue average, bulk sequencing is often sufficient. If it concerns the source of the signal, cellular composition, rare populations, or region-specific pathology, cell-resolved sequencing is the stronger instrument. The decisive variable is not platform prestige. It is whether the data structure preserves the biological distinction the research question depends on.