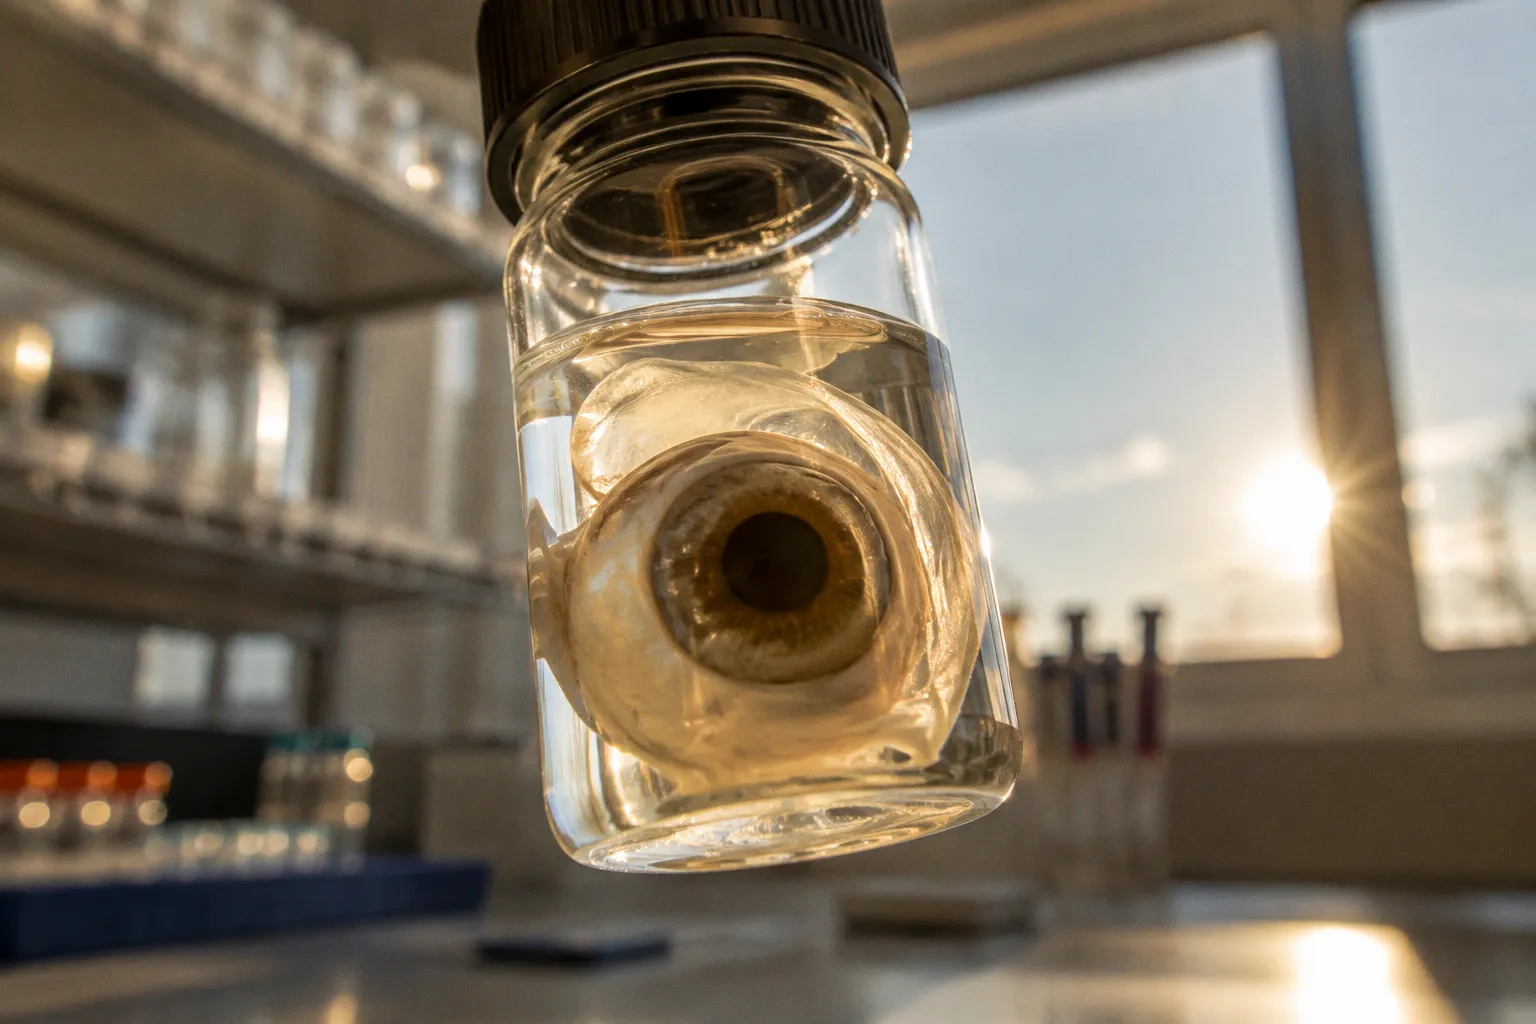
Simultaneous RNA sequencing detects 22,446 transcripts in human donor retina, while TMT quantitative mass spectrometry identifies 6,109 proteins from the same broad tissue context. Layer-specific GeoMx Digital Spatial Profiling captures approximately 18,646 genes within constrained 600 µm² regions of interest spanning the major retinal layers. The RNA layer appears deeper at the catalogue level. The protein layer appears narrower. Yet the protein layer is closer to the machinery that actually builds membranes, maintains synapses, transports metabolites, and fails during degeneration.
That difference matters because a retina is not a uniform sheet of neural tissue. It is a layered system in which photoreceptors, Müller glia, retinal pigment epithelium, ganglion cells, vascular elements, and immune populations occupy tightly constrained anatomical territories. A method that expands the molecular inventory but dissolves the tissue map answers one set of questions. A method that preserves protein identity but averages across a complex sample answers another.
The practical question behind spatial transcriptomics vs proteomics in donor retina is therefore not which platform produces the larger number. It is which molecular layer remains interpretable after the tissue has passed through procurement, cooling, dissection, fixation, sectioning, and the slow biochemical drift of the postmortem interval.
Analytical depth is not the same as biological depth
RNA sequencing begins with a substantial numerical advantage. In the donor-retina comparison, simultaneous RNA sequencing detected 22,446 transcripts. TMT-based quantitative mass spectrometry identified 6,109 proteins. Layer-specific GeoMx spatial profiling resolved approximately 18,646 genes across anatomical regions of interest. At first glance, transcriptomics seems to offer the more complete molecular survey, with a broader catalogue of expressed genes and a higher capacity to distinguish cellular states.
That conclusion is only partly correct.
A transcript is a record of molecular instruction, not the finished structure. It can indicate that a photoreceptor is activating a stress response, that an RPE cell is altering lipid handling, or that a Müller glial population is entering a reactive state. But mRNA abundance does not directly equal protein abundance. Translation efficiency, protein turnover, post-translational modification, compartmental transport, and degradation all intervene between transcription and function.
The proteome is smaller in detectable breadth because proteins are analytically harder to measure. They differ widely in abundance, solubility, charge, enzymatic stability, and susceptibility to extraction bias. A highly abundant structural protein can dominate the signal while a low-abundance transcription factor remains below the practical detection threshold. In retina, this dynamic is amplified by the extraordinary concentration of phototransduction machinery, mitochondrial proteins, cytoskeletal components, and synaptic proteins in distinct cellular compartments.
The two outputs should therefore be read as complementary layers rather than competing inventories:
| Parameter | Simultaneous RNA sequencing | Spatial transcriptomics (GeoMx) | Deep TMT proteomics |
|---|---|---|---|
| Primary signal | RNA molecules and gene expression programs | Layer- or region-resolved RNA abundance | Quantified proteins and protein abundance |
| Analytical breadth in donor retina | 22,446 transcripts detected | Approximately 18,646 genes profiled in 600 µm² layer-specific ROIs | 6,109 proteins identified |
| Spatial behavior | Bulk; no native spatial resolution | Preserves layer or region-specific expression on tissue sections | Bulk unless paired with microdissection or imaging |
| Biological interpretation | Regulatory state, cell identity, transcriptional programs | Layer-resolved regulatory programs | Structural machinery, enzymes, transporters, receptors |
| Main blind spot | Transcript abundance does not equal protein abundance or localization | ROI may span multiple cells; transcript ≠ protein | Bulk signal averages tissue; needs intact protein for detection |
| Best use in donor retina | Cataloguing expressed genes and pathways | Mapping where transcriptional programs emerge | Confirming which protein machinery is present and quantitatively altered |
The disparity between 22,446 transcripts and 6,109 proteins is not a failure of proteomics. It reflects the fact that RNA sequencing and mass spectrometry observe different molecular objects under different constraints. The larger transcript count can reveal a wider regulatory landscape; the protein count can provide a more direct view of the cellular apparatus operating within that landscape. The 18,646 genes captured by GeoMx belong to a different category entirely: a spatially constrained catalogue whose value lies in where each gene is expressed, not in the total number identified.
A transcript can mark the beginning of a pathway. A protein shows that part of the pathway survived translation, transport, folding, and the postmortem interval.
This distinction becomes especially important in retinal degeneration, where the first detectable event may be transcriptional, while the lesion that disrupts vision is structural or enzymatic. A cell may increase a stress-response transcript before the corresponding protein accumulates. Conversely, a stable protein may remain detectable after its transcript has fallen, preserving evidence of an earlier cellular state that RNA alone no longer captures.
GeoMx turns the retinal layer into a molecular coordinate system
The retina is unusually suited to spatial molecular analysis because its architecture is already organized into recognizable layers. The ganglion cell layer, inner nuclear layer, inner plexiform layer, outer plexiform layer, photoreceptor layer, and retinal pigment epithelium are not interchangeable anatomical compartments. They contain different cell populations, different synaptic geometries, different metabolic burdens, and different failure modes.
GeoMx Digital Spatial Profiling makes that architecture analytically useful. In human donor retina, layer-specific transcript profiles were captured across approximately 18,646 genes in 600 µm² regions of interest spanning the major retinal layers. The critical achievement is not simply the number of genes. It is the ability to ask where a gene-expression program is concentrated.
A transcript detected in the RPE does not carry the same implication as the same transcript detected in the ganglion cell layer. Localization narrows the pathology. It converts a list into a sequence.
Consider the RPE adjacent to drusen deposits. Spatial RNA profiling with the Visium HD platform identified localized upregulation of galactosyltransferases, ABCA5, MT-ND4L, and VIM in RPE cells directly next to drusen. The finding does not establish a complete causal pathway, and it does not mean that the local RNA increase is equivalent to a matching protein increase. It does, however, identify a molecularly distinct microenvironment at the border of the deposit.
That border is where the pathology becomes legible. Drusen are not merely inert accumulations observed beneath the RPE. Their immediate cellular neighborhood can show altered lipid handling, mitochondrial-associated signals, cytoskeletal remodeling, and stress-linked changes. Spatial transcriptomics detects this local response before it is diluted into an average obtained from a larger piece of macula.
The 600 µm² region of interest is also a reminder that spatial resolution has a physical scale. It is not synonymous with perfect single-cell resolution. A region can contain more than one cell type or capture transcripts that diffuse, overlap, or originate from adjacent structures. The map is spatially constrained, but its interpretation still depends on retinal anatomy, marker genes, segmentation strategy, and the quality of the section.
This is where the phrase spatial gene expression versus retinal proteome becomes misleading if treated as a simple contest. GeoMx can tell us that a transcriptional program is concentrated in a layer or region. Deep proteomics can tell us that a set of proteins is present across the sampled tissue. Neither output alone reconstructs every molecular event at single-cell resolution.
What spatial transcriptomics reveals especially well
Spatial transcriptomics is strongest when the question concerns distribution, compartmentalization, and the progression of a cellular state across tissue architecture. In donor retina, that includes:
- distinguishing RPE-associated expression from signals arising in the neural retina;
- resolving layer-enriched programs in the GCL, INL, IPL, OPL, photoreceptor layer, and RPE;
- locating disease-associated expression near drusen or other anatomical lesions;
- identifying whether mitochondrial, lysosomal, inflammatory, or cytoskeletal programs are focal or diffuse;
- comparing preserved and damaged regions within the same donor eye when tissue quality permits.
This layer of information is indispensable in optic neuropathy and retinal degeneration, where anatomical adjacency often carries mechanistic meaning. A transcript induced in an RPE cell directly bordering a deposit may indicate a local response that disappears when the entire macula is homogenized.
But spatial transcriptomics also carries a familiar danger: the map can appear more mechanistic than it is. A localized transcript is evidence of localized transcriptional activity. It is not automatically evidence of protein production, altered protein function, or a completed disease pathway.
Deep proteomics preserves the machinery, but usually not the coordinates
TMT quantitative mass spectrometry approaches the donor retina from a different direction. Instead of asking where a transcript is expressed, it measures proteins extracted from the tissue and compares their abundance across samples. This is a powerful way to examine the molecular machinery that remains physically present: metabolic enzymes, extracellular matrix components, phototransduction proteins, mitochondrial complexes, cytoskeletal elements, and proteins associated with synapses or cellular stress.
The 6,109 proteins identified in human donor retinas represent a substantial molecular survey. They include more than passive markers of cell identity. They can expose changes in pathway capacity, protein turnover, structural integrity, and the persistence of disease-associated effectors after transcriptional activity has shifted.
Yet deep proteomics has a spatial limitation that must remain visible. Unfractionated liquid chromatography–mass spectrometry does not resolve exact cellular coordinates by itself. Once the tissue has been homogenized, the signal represents the combined contribution of the material that entered the extraction. A protein associated with Müller glia, RPE, photoreceptors, or vascular structures may be detectable, but its precise anatomical origin is not guaranteed by the mass-spectrometry readout alone.
That limitation is not a minor technical footnote. It determines the type of claim the dataset can support. A proteomic difference between two donor-retina samples may indicate altered pathway activity, but it cannot automatically identify the retinal layer in which the change began. Microdissection, regionally defined sampling, immunohistochemistry, or multiplex spatial imaging is required to restore that coordinate system.
The most effective retinal multiomics workflows treat deep proteomics as an anchor for molecular reality. Transcriptomics may nominate a pathway. Proteomics tests whether the pathway has a detectable protein-level footprint. Spatial imaging can then determine where the relevant proteins are located.
The role of IBEX in protein-level mapping
Iterative Bleaching Extends Multiplexity, or IBEX, addresses the spatial problem without pretending that it is solved by bulk mass spectrometry. In intact human donor-retina sections, IBEX enabled multiplex imaging of more than 25 protein markers at the same time. This allows major cell populations and ultrastructural features to be delineated directly within the tissue.
The method is particularly useful because retinal pathology is often a problem of adjacency. A protein may be elevated in a Müller glial endfoot, concentrated around a synaptic layer, or associated with a boundary between the neural retina and the RPE. The question is not only whether the protein exists, but whether it occupies the anatomical site where the lesion is developing.
Super-resolution IBEX identified CD44 as a core structural component tightly colocalized with an F-actin belt within Müller glial endfeet at the outer limiting membrane. That observation carries a different kind of information from a transcriptomic marker. It places a protein within a defined structural arrangement at the OLM, where cell–cell contacts and retinal barrier organization depend on precise cytoskeletal architecture.
CD44 expression in a transcriptomic table would not, by itself, establish this structural relationship. Nor would a bulk proteomic measurement reveal the exact colocalization with the F-actin belt. The observation emerges from protein-level spatial imaging, where molecular identity and tissue position are measured together.
This is the crucial distinction between deep proteomics and spatial proteomics. The former can achieve exceptional analytical depth across extracted tissue. The latter preserves or reconstructs spatial context through imaging, targeted sampling, or molecularly resolved tissue analysis. They should not be collapsed into one category simply because both concern proteins.
Postmortem interval changes the question before it changes the data
Donor ocular tissue arrives with a clock already running. The postmortem interval is not a single destructive event. It is a sequence of temperature-dependent and tissue-dependent processes: oxygen depletion, membrane instability, enzymatic activity, RNA fragmentation, protein modification, cellular compartment collapse, and changes introduced during recovery and storage.
For donor-retina multiomics, the practical concern is whether a longer interval makes the molecular profile uninterpretable. The available comparison offers a more precise answer than a blanket warning about degradation.
When the postmortem interval cutoff was extended from 12 to 18 hours, and donor eyes were stored at 2°C–8°C, TMT proteomics showed no significant differential expression across all 6,109 proteins, with every adjusted P value above 0.05. RNA sequencing showed significant changes in only 5 of 22,446 transcripts under the stated threshold of adjusted P < 0.1 and Log2FC > 1.
The finding does not mean that postmortem biology stops. It means that, under controlled cooling and within this comparison, extending the cutoff by six hours did not produce broad molecular deterioration detectable in the measured protein set and produced only limited transcript-level changes under the reported criteria.
That distinction is important for eye-bank logistics. A rigid twelve-hour boundary may exclude tissue that remains analytically useful, particularly when the study is designed around protein integrity or when the donor eye has been consistently maintained under controlled refrigeration. But the result should not be generalized into a universal permission to ignore PMI. Storage temperature, tissue region, donor condition, cause of death, agonal state, recovery timing, fixation chemistry, and extraction protocol still shape the final dataset.
The data also reveal an intriguing asymmetry: protein-level measurements appeared stable across the 12-to-18-hour extension, while a small number of transcripts crossed the significance thresholds. This does not prove that proteins are universally more stable than RNA in donor retina. It indicates that, in this particular controlled window and dataset, the proteomic signal was not significantly altered across the measured proteins, whereas a limited transcriptomic signal shifted.
For comparative studies, the implication is operational rather than rhetorical: PMI cutoffs and tissue handling protocols should be set by the analyte the study values most, not by an inherited convention. Studies built on protein integrity may tolerate a longer window than studies built on rare or low-abundance transcripts. Studies built on spatial RNA may require tighter cooling and faster recovery than studies built on bulk proteomics. The data argue for analyte-specific protocols rather than a single universal cutoff.
Bridging the gap between transcript and protein layers
The strongest claims in donor-retina multiomics emerge when the two layers converge rather than compete. Integration is not a simple matter of overlapping gene lists. RNA-seq and TMT proteomics measure different molecular objects under different biochemical and analytical constraints, and their agreement is informative precisely where it breaks.
In the donor-retina comparison, transcriptomic and proteomic measurements can be aligned at the gene-symbol level, but the underlying distributions are not equivalent. A transcript may be abundant because the cell has activated a stress program; a protein may be scarce because it is rapidly turned over. Conversely, a stable structural protein may persist long after its mRNA has decayed. Correlation analyses across matched samples can therefore expose the regulatory logic of the tissue: where transcription and translation agree, where they diverge, and where post-translational control is dominant.
The practical workflow in donor retina typically moves in three steps. Transcriptomics nominates candidates — a pathway, a cluster of genes, a layer-enriched signature. Proteomics tests whether the corresponding protein machinery is detectable in the tissue. Spatial imaging — GeoMx for RNA, IBEX for protein — assigns the relevant signal to a defined anatomical coordinate. Each step narrows the hypothesis space. None of them replaces the others.
This integrated logic explains why donor-retina research has moved from single-platform studies toward combined RNA-seq plus TMT proteomics on the same donors, often accompanied by spatial assays on adjacent sections. The technical cost is real — extracting high-quality RNA and protein from the same eye, balancing sampling for two analytical pipelines, and accepting that the same eye cannot be measured twice at the same coordinate — but the interpretive gain is substantial. Discordant results become biological information rather than analytical noise.
When transcriptomics indicates an inflammatory program in the outer retina but proteomics does not detect the corresponding cytokine effectors, the divergence may point to post-transcriptional regulation, rapid protein clearance, or sampling of a tissue region where the inflammatory signal is spatially restricted. When both layers agree, the case for mechanistic involvement is correspondingly stronger.
The integrated retina dataset is not a list of intersecting genes. It is a layered record of where transcription occurred, where protein survived, and where the two align.
Integration also clarifies the appropriate resolution for each question. A transcriptomic atlas across retinal layers can nominate the most informative layers for targeted proteomic sampling. A spatially resolved proteomic atlas can highlight proteins whose abundance is genuinely localized, and therefore worth checking against spatially resolved RNA data. Bulk measurements, in turn, can confirm that a layer-specific signature is not merely an artifact of an unusually small region of interest.
This is the practical shape of spatial gene expression versus retinal proteome when both are available: not a contest, but a triage. The transcript catalogue tells the analyst which molecular programs are running. The spatially resolved transcript set, anchored at 18,646 genes across the major retinal layers, tells the analyst where those programs are concentrated. The protein catalogue confirms which machinery survived the biochemistry of the tissue. The spatially resolved protein imaging places that machinery inside specific cells and structures. Each platform narrows the question; none of them answers it alone.