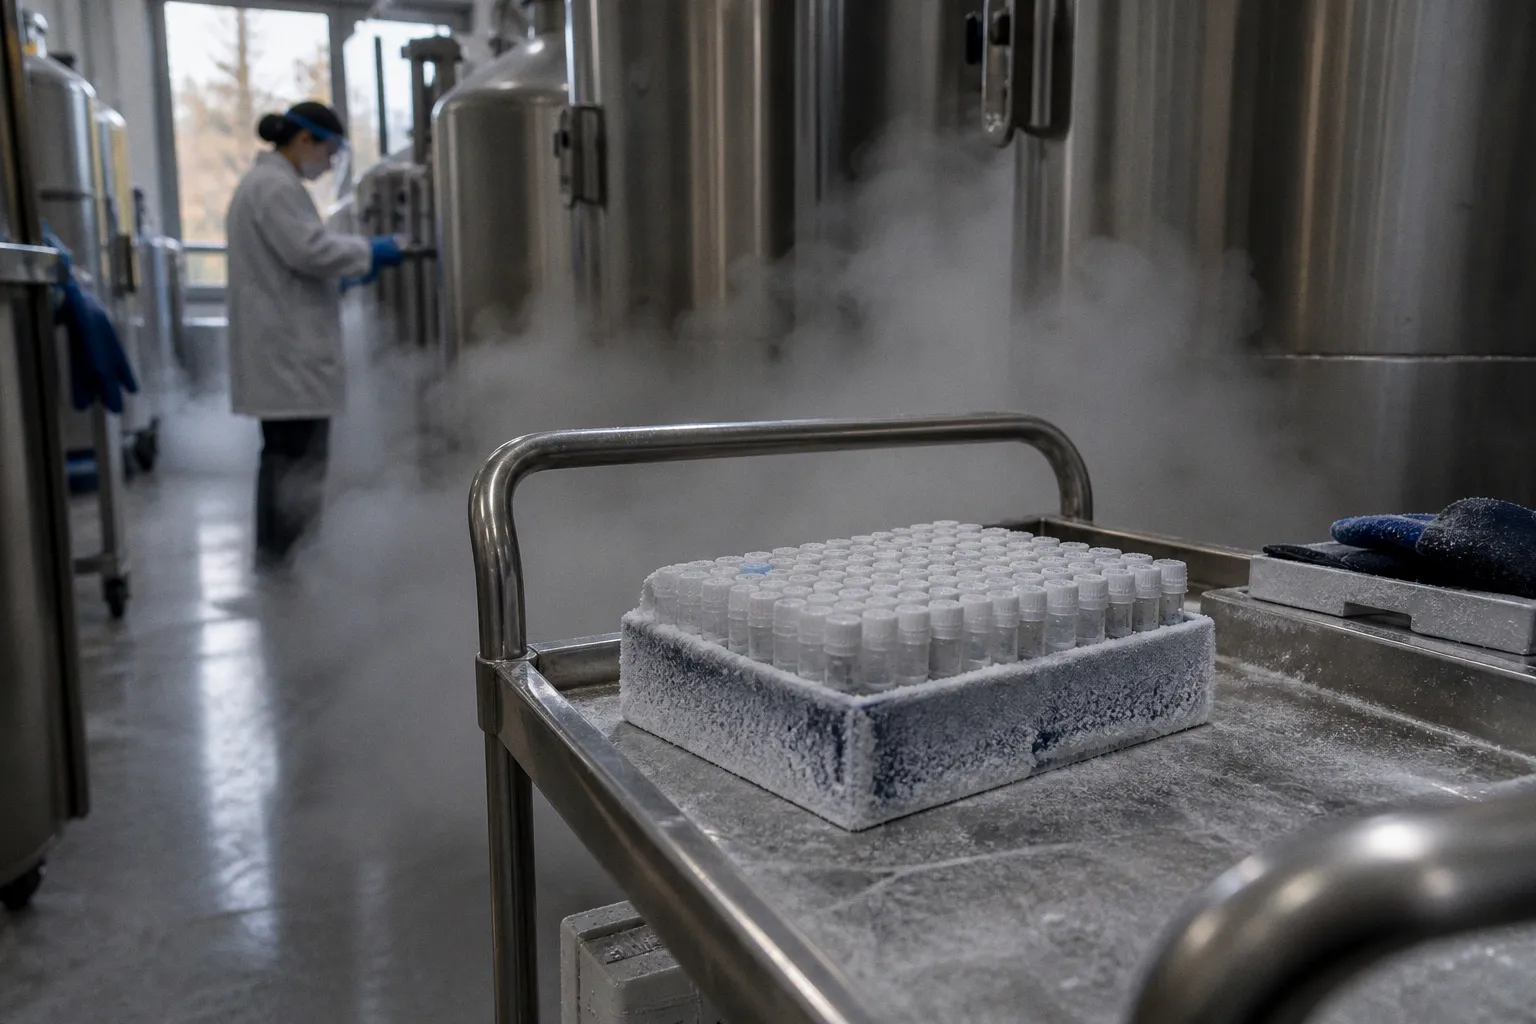
Two retinas removed at different post-mortem intervals will not necessarily return the same transcriptomic profile. The difference may reflect tissue degradation, donor biology, handling, or some combination of all three. Degradation kinetics across neuronal and glial subpopulations can diverge quickly enough for a longer-PMI donor to occupy a distinct region of the latent space. That does not make the donor a separate biological class, but it does create a signal that integration methods must account for.
The procurement pipeline cannot reverse information that was never recorded. Computational correction cannot reliably disentangle variables once donor biology and technical handling have been locked into the same principal component or latent dimension. The hard constraint at the foundation of every ocular scRNA-seq study is therefore not the choice between Harmony, BBKNN, scVI, or another integration framework. It is whether donor variability has been parsed into its biological and technical constituents before the matrix enters a clustering pipeline. When that parsing fails upstream, every downstream visualization inherits the ambiguity.
The anatomy of ocular batch effects: two variance stacks, not one
Batch effects in retinal single-cell transcriptomics are best understood as one part of a larger variance structure. Two stacks are usually present, but they should not be treated as interchangeable.
The first stack is biological: donor genetics, age, sex, anatomical subregion such as foveal or peripheral retina, disease state, agonal history, and the microenvironment of the donor eye at the moment of circulatory arrest. These variables may be the signal a study is trying to measure.
The second stack is technical: enzymatic dissociation protocol, post-mortem interval (PMI), capture platform, sequencing depth, ambient RNA contamination, and the temperature history of the tissue during transit from procurement to processing. These variables may distort or obscure that signal. PMI occupies an awkward position because it is recorded as a handling variable but can produce biological-looking consequences, including stress-response transcription and cell-type-specific loss.
In a single dataset, the two stacks are rarely separable by inspection. A consortium pulling retina from several eye banks may find that donor age covaries with PMI because older donors more often arrive through longer routing paths. A study pairing healthy and glaucomatous donors may confound disease state with capture chemistry if the diseased cohort was processed on a newer instrument or during a different reagent lot. If all donors in one condition were handled together, the latent space will absorb both signals.
Harmony, BBKNN, scVI, and Seurat anchor workflows can help when the technical axes are represented in the metadata and are not perfectly aligned with the biology of interest. They are much less informative when the design provides no independent variation with which to distinguish those axes. Integration can reduce unwanted structure; it cannot determine whether a difference between two completely confounded groups is biological or technical.
Batch correction is not a substitute for experimental design. It is a downstream patch for design decisions already made.
A useful procurement record therefore needs more than a donor identifier. At minimum, it should preserve the variables that explain how the tissue moved from donor to library: time of death or circulatory arrest where available, time to media immersion, arrival and processing timestamps, anatomical sampling location, dissociation duration, operator or protocol version, capture chemistry, library preparation batch, and sequencing run. The point is not to collect metadata for its own sake. It is to create enough variation and documentation to test whether a suspected batch effect tracks the tissue, the donor, the laboratory process, or the biology under study.
When donor variability becomes uncorrectable
Computational integration has a hard ceiling. No method can reconstruct a comparison that the experimental design has made unidentifiable.
If every glaucomatous donor was processed on platform A and every control donor on platform B, a difference between the resulting integrated populations may reflect glaucoma biology, platform chemistry, or both. The algorithm has no ground truth that can disambiguate those explanations. The integrated representation may look balanced while the underlying causal question remains unresolved.
This is not an argument against integration. It is an argument for treating integration as conditional inference rather than restoration. A method can align shared populations, reduce donor-associated geometry, and improve visualization. It cannot certify that the aligned dimensions now represent biology.
The retina makes this problem particularly visible for several reasons:
1. Rare neuronal populations amplify sampling differences. Macular populations such as rod bipolar cells, midget ganglion cells, and horizontal cells are sparse relative to photoreceptors and Müller glia. Small differences in capture efficiency or cell survival can therefore produce large changes in the observed composition of an integrated object. A missing or overrepresented population is not automatically a batch artifact, but it is a reason to examine recovery, cell numbers, and donor contribution before interpreting the cluster.
2. PMI can overlap with genuine stress biology. Post-mortem delay affects photoreceptor outer segments and retinal pigment epithelium in ways that may overlap with ischemic decay, dissociation stress, and disease-associated transcriptional programs. Without paired material, replicated donors, or an appropriate reference, distinguishing technical degradation from biological activation is often probabilistic rather than definitive.
3. Disease cohorts are genetically heterogeneous. Inherited retinal dystrophies and glaucoma include substantial allelic and clinical heterogeneity. Donor-to-donor genetic and phenotypic differences within a disease cohort may be large enough to complicate comparisons with controls. An integration method that compresses this variance may improve visual alignment while weakening the disease signal the study was designed to detect.
4. Anatomical labels do not guarantee anatomical comparability. “Retina” can refer to tissue collected from materially different regions, with different proportions of photoreceptors, ganglion cells, vascular-associated cells, and retinal pigment epithelium. A region effect can resemble a donor effect when sampling locations are not recorded at sufficient resolution.
There is no universal PMI threshold at which a dataset changes from usable to unusable. The impact depends on tissue handling, preservation medium, cell type, disease context, and the assay itself. What is established operationally is that unrecorded PMI is a major point of failure. A biobank that does not log the interval from circulatory arrest to media immersion is transferring a silent confounder into every downstream analysis performed on that tissue.
The same caution applies to donor imbalance. A cluster dominated by one donor or one collection site may be a real population, a sampling consequence, a survival difference, or a technical artifact. Its interpretation requires raw counts, donor-aware models, marker consistency, and independent biological evidence. Donor enrichment is a warning sign, not a verdict.
Integration frameworks in practice: Harmony, BBKNN, scVI, and the Seurat anchor stack
The practical integration stack for retinal scRNA-seq usually runs across several layers. Highly variable gene selection feeds a low-dimensional representation; a neighbor graph is then constructed and corrected against one or more designated variables, commonly donor, collection site, capture date, or chemistry lot. The choice of variable matters. Correcting for donor may remove unwanted technical structure, but it may also remove genuine donor biology if donor is the unit in which the biological effect is expressed.
The following comparison is operational rather than a ranking:
| Framework | Correction mechanism | Typical use case in ocular datasets | Important limitation |
|---|---|---|---|
| Harmony | Iterative soft clustering in PCA space, with a penalty for batch imbalance | Multi-donor retinal atlases and cross-platform merging | Aggressive settings can compress subtle differences in rare populations or continuous states |
| BBKNN | Constructs neighborhoods using within-batch neighbors | Large donor cohorts where local donor balance is a priority | Can distort long-range topology in sparse inner nuclear and ganglion cell populations |
| scVI | Variational autoencoder with batch and other variables represented in a generative model | Datasets with multiple covariates, including age or PMI | Results depend on model specification, training choices, and adequate representation of the relevant covariates |
| Seurat anchors, including CCA or RPCA workflows | Identifies correspondences between datasets using shared representations or reciprocal PCA | Two-dataset and multi-site merges with shared cell types | Anchor selection becomes unstable when disease biology changes cell-type frequency or state |
| ComBat or MNN-style approaches | Empirical Bayes adjustment or mutual nearest-neighbor matching | Small cohorts and legacy integration workflows | Can be too aggressive for sparse single-cell matrices and over-smooth rare photoreceptor subtypes |
The table does not answer which method should be used. That decision depends on the experimental question, the number and structure of donors, the degree of overlap between datasets, and the covariates that were actually recorded. A method designed for donor correction is not automatically appropriate for removing disease-associated donor variation. Likewise, a model that includes PMI as a covariate cannot estimate its effect if PMI is missing, poorly measured, or perfectly confounded with the condition of interest.
The standard workflow also needs a clear separation between representations. The integrated space can be used to construct a neighbor graph, visualize relationships, and support cluster discovery. That does not mean the corrected values should replace the original counts for every subsequent analysis. An integrated embedding is an analytical view of the data, not a new measurement of RNA abundance.
Resources such as scRetinaDB can apply integration methods when consolidating multi-donor human retinal datasets, but a database-scale atlas inherits the weaknesses of its source material. If one contributing site reports PMI precisely and another records only a broad processing category, the difference is not cosmetic. It changes what can be modeled. If anatomical region is missing from one cohort, regional biology may appear as a site effect. If dissociation duration is absent, a stress signature may be mistaken for a disease-associated state.
A state-of-the-art pipeline applied to a metadata-poor dataset can return a publication-grade figure and an underdetermined biological conclusion. Both arrive in the same output folder.
Preserving data integrity: why raw UMI counts must remain untouched
A consistent rule in single-cell analysis is that the raw UMI count matrix should remain available for statistical testing after integration. Integration operates on a corrected latent space, a batch-aware neighbor graph, or an anchored low-dimensional representation. Those outputs are useful for dimensionality reduction, clustering, and visualization. They should not be treated as interchangeable with the original counts in differential expression testing.
The reason is structural. Batch correction methods impose shared organization across cells. Two cells from different donors that were not close in the raw count space may become neighbors in the corrected graph. Depending on the method, the representation may contain smoothed, transformed, or partially reconstructed information. A differential expression test run directly on that integrated representation can understate uncertainty, inflate apparent replication, or produce effect sizes that are difficult to interpret biologically.
The statistical unit is especially important in ocular datasets. Cells are nested within donors, and donors are often nested within collection sites or processing batches. Treating thousands of cells as independent biological replicates can make a modest donor difference look overwhelmingly significant. Donor-aware linear mixed models, including MAST formulations with donor as a random effect, can account for part of this structure. Pseudobulk approaches provide another clear route: sum raw UMI counts for each cell type or state within each donor, then use a bulk RNA-seq model such as DESeq2 with donor-level samples.
Pseudobulk does not solve every problem. It cannot recover a cell type that was never captured, correct a perfectly confounded design, or distinguish a disease effect from a site effect that has no independent replication. It does, however, prevent the common error of treating cells from one donor as if they were independent donors.
The separation between corrected and raw data should be visible in the analysis object. In Seurat workflows, integrated output can be stored in a separate assay layer while the counts remain available in their original form. In other frameworks, the same principle may be implemented through separate matrices or object slots. The software architecture is less important than the provenance rule: every transformed representation should be traceable back to the unmodified count data and the preprocessing steps that produced it.
A clean UMAP is not evidence of clean integration. It is a visualization of the assumption that batch and biology are separable.
Before differential expression is reported, the analysis should make several distinctions explicit:
- Was the test performed on raw counts, normalized counts, or an integrated representation?
- What is the biological replicate: cell, donor, eye, or collection site?
- Were donors with very different PMI or anatomical origins compared directly?
- Does the model include the variables that were used for integration?
- Are the reported markers stable when the analysis is repeated with donor-level aggregation?
- Do the same markers appear in independent donors, or are they driven by one library?
These questions are not administrative overhead. They determine whether a marker is associated with a cell type, a donor, a handling condition, or the integration procedure itself.
Beyond UMAP: detecting residual artifacts in retinal cell atlases
A UMAP that looks clean is not evidence of clean integration. Visual mixing of donor colors can coexist with residual technical structure, and an apparently separated population can reflect real biology that was previously obscured by a dominant batch effect. Neither visual outcome is self-interpreting.
Standard diagnostics such as silhouette score, kBET, batch entropy, and donor-mixing summaries are useful but incomplete. Some reward mixing even when meaningful biological structure has been over-corrected. Others detect global imbalance while missing a donor-specific stress program inside an otherwise well-mixed cell type. Marker inspection can reveal what a two-dimensional embedding hides: a cluster that appears to form a continuous trajectory may separate into donor-associated groups when scored against dissociation-induced or stress-response genes.
Residual-artifact analysis should therefore combine several kinds of evidence.
Check donor contribution without turning imbalance into a verdict
Per-donor representation within each cluster is a sensible first diagnostic. A cluster that is almost entirely supplied by one donor, one site, or one chemistry lot deserves scrutiny. But there is no universal ratio that proves the cluster is an artifact. Expected representation depends on donor cell yield, tissue region, disease composition, sequencing depth, and the biological abundance of the population itself.
The correct interpretation is conditional. Strong donor enrichment is a dataset-specific warning sign that should trigger comparison with raw counts, cell-quality metrics, donor-aware models, and independent markers. It may indicate a batch effect, but it may also reflect genuine biology, unequal sampling, or differential cell survival. A cluster cannot be classified from its donor ratio alone.
Compare integrated and unintegrated representations carefully
The raw count space and the integrated space answer different questions. A population that becomes visible only after integration may be a biological structure that technical variation had obscured. It may also be a model-dependent separation created by the integration procedure. Conversely, a population that is less distinct in the raw embedding is not automatically false; raw technical noise can mask real cell types.
The useful question is not whether a cluster appears in both embeddings in exactly the same form. It is whether the cluster is supported across representations and evidence types:
- Do its marker genes remain detectable in raw, donor-stratified data?
- Does it contain cells from more than one donor or site where such overlap is biologically expected?
- Is the signal driven by canonical identity genes, by stress and dissociation genes, or by mitochondrial and ribosomal content?
- Does the population recur in an independent dataset or anatomical sample?
- Does a donor-aware model preserve the distinction?
A cluster present only in the integrated space should be treated as a hypothesis requiring validation, not automatically dismissed as an artifact. A cluster present only in the raw space deserves the same caution: raw separation may reflect technical variation that integration has correctly reduced.
Test dissociation and PMI-associated programs
Each cell can be scored against a validated dissociation or stress-response gene set, with the score examined by donor, site, PMI, and cell type. Elevated scores in one donor's contribution to an otherwise shared population are a meaningful artifact signal. They become more persuasive when they align with longer PMI, longer dissociation time, lower complexity, or a particular processing batch.
The analysis should also distinguish broad stress from identity. Photoreceptors and retinal pigment epithelium are particularly prone to misleading structure because both can express stress-associated transcripts and both are sensitive to handling conditions. A cluster defined mainly by immediate-early, heat-shock, hypoxia-related, or dissociation-associated genes may represent a cell state shared across types rather than a new cell type. That conclusion should be tested against canonical markers and donor-level replication.
Use donor-level differential expression
A pseudobulk differential expression test, with the donor as the replicate and summed raw UMI counts for each cell type or state, is a useful stress test for integrated clusters. Markers that disappear when donor-level replication is enforced are not necessarily false, but their original significance was likely dependent on cell-level pseudoreplication or a single donor. Markers that remain stable across donors and survive donor-aware modeling have stronger support.
The model should reflect the study design. If site, disease state, sex, age, and PMI are all relevant, a model that includes only donor may still leave important structure unexplained. At the same time, adding every recorded variable to a small cohort can make the model unstable. The goal is not maximal adjustment. It is a defensible representation of the sources of variation that could plausibly explain the result.
Inspect quality metrics in their biological context
Mitochondrial fraction, detected genes, total counts, ambient RNA, and doublet scores should not be interpreted as universal pass-or-fail thresholds. Retinal cell types naturally differ in RNA content and susceptibility to damage. A threshold that removes damaged cells from one population may preferentially eliminate a legitimate state from another.
Quality metrics should be examined by donor and cell type, then linked to the procurement record. If one donor contributes cells with systematically lower complexity and higher mitochondrial content, the problem may begin with PMI or transport rather than with library preparation. If ambient RNA from photoreceptors appears in unrelated populations, marker interpretation must account for the contamination pattern before a rare retinal subtype is declared.
Validate against independent biological evidence
The strongest support for a retinal cell population comes from converging evidence: canonical markers, donor representation, anatomical plausibility, raw-count support, appropriate statistical replication, and recurrence in an independent sample or atlas. No single metric can substitute for that convergence.
Integration should make these comparisons easier, not make them unnecessary. A latent space is a tool for organizing evidence. It is not evidence that the organization is biologically correct.
Closing assessment
The procurement-to-publication pipeline for human ocular scRNA-seq is governed by a hierarchy of constraints that runs upstream of every algorithm. Donor metadata completeness—PMI, dissociation time, capture chemistry lot, agonal history, anatomical subregion, and processing site—sets the upper bound on what integration can recover. Computational frameworks operate within that bound. When the design has completely confounded biological condition and technical batch, the software may still produce a coherent embedding, but coherence is not identification.
Raw UMI counts and donor-aware statistical models remain the statistical floor. Integrated embeddings and UMAP remain visualization and discovery tools. The two functions do not interchange. A corrected latent space can support clustering without becoming the input for every differential expression test. A visually balanced atlas can still carry donor-specific stress programs. A donor-enriched cluster can be a technical artifact, a true biological population, or a sampling consequence; its ratio alone cannot decide among those explanations.
The practical rules are therefore straightforward, even when their implementation is not: log the covariates at donor resolution, preserve the raw counts, model the donor structure, score dissociation and stress programs, compare raw and integrated representations, pseudobulk before claiming differential expression, and treat every newly separated integrated population as a hypothesis requiring independent support.
There is no universal cutoff that converts donor imbalance into proof of an artifact. There is no rule that makes a cluster absent from a raw embedding automatically unreal. There is also no integration method that substitutes for a design in which biology and technical handling were separated before processing began.
Ocular biobanks that maintain that distinction produce datasets that can be integrated, interrogated, and replicated with appropriate caution. Those that do not may still produce visualizations that look like atlases. The difference is decided upstream of the algorithm—in the procurement record, the sampling plan, and the metadata schema, before a single cell is captured.